Meta ads agency

Stop spending on Meta ads that do not convert. Start scaling the ones that do.

Most ecommerce brands run Meta ads and cannot prove what works. Which campaign drove your last 50 sales? Why does one creative beat another by 6x? What is your true return after Meta's self-credit? Redefine answers all three.

0x avg return
Client median
0+
Brands managed
5-day
Launch timeline
Redefine Campaign Manager
Live
Blended return on ad spend · Last 30 days
4.8
x
+1.2x versus last month
CPM
$12.40
CPA
$18.72
ROAS
4.8x
Active campaigns
Prospecting · Lookalike 2%
6.2x
Live
Retargeting · Cart abandons
9.1x
Live
Creative test · Video variants
2.4x
Testing
Broad · Advantage+ catalog
0.9x
Paused
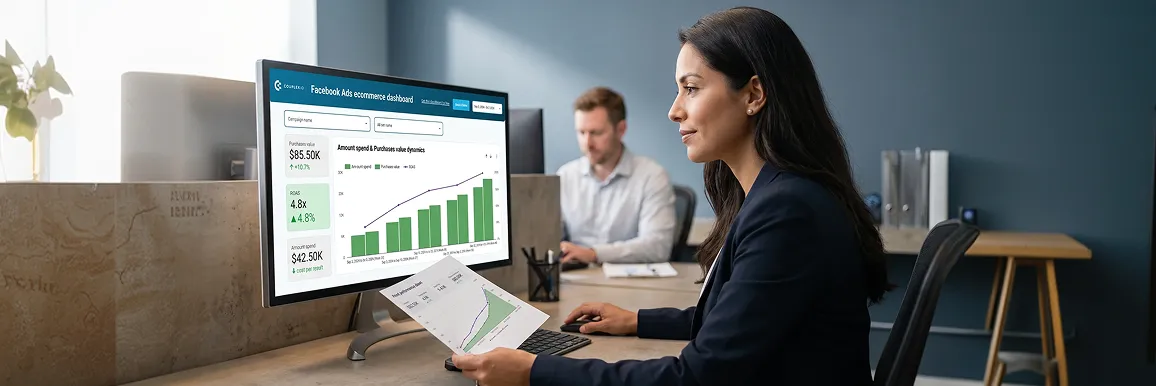
Meta ads media buyer at standing desk with dual monitors showing Meta Ads Manager campaign data in warm screen glow
The Meta Ads attribution problem

Meta claims credit for sales it did not cause. Most brands believe it.

Meta's default window credits a 7-day click and a 1-day view. So Meta claims anyone who merely saw your ad. It counts sales from email, organic search, or repeat visits with no ad click. The gap between Meta's report and reality runs 30 to 50%.
What Meta Ads Manager reports
Reported return on ad spend
7.4x
Attributed revenue
$148,000
Conversions credited
1,973
Cost per acquisition
$10.14
The problem
Meta claims 7-day click + 1-day view attribution. View-through conversions can be customers who never clicked any ad. Your GA4 shows only 1,140 conversions from Meta. Who is right?
What actually happened (with proper attribution)
True blended return on ad spend
4.8x
Attributable revenue
$96,000
Real Meta-sourced conversions
1,140
True cost per acquisition
$17.54
What this means
Your true cost per acquisition is 73% higher than Meta claims. Your budget decisions are wrong. The Redefine audit shows which campaigns are genuinely profitable and what to cut this week.
Marketing leader at desk reviewing Meta Ads Manager with true return on ad spend now clear and climbing, calm and confident under natural light
Campaign transformation

The same ad budget. Completely different results.

Toggle between a typical Meta setup and what Redefine builds for the same brand. Same monthly spend. A different campaign structure, attribution model, and return outcome.e.

$34
Cost per acquisition
1.9x
True return on ad spend
$28
Cost per thousand impressions
1.1%
Click-through rate
What was wrong
No audience segmentation, one broad campaign for all objectives
Prospecting and retargeting audiences fought each other. That inflated your CPM. You paid to show ads to people who already bought.
No creative rotation, same 2 ads running for 8 months
Creative fatigue dropped click-through from 2.4% to 0.9% in 3 months. No new tests meant no way out of the decline.
Platform-reported attribution misleading budget decisions
Agency was reporting 4.2x return on ad spend from Meta dashboard. True blended return on ad spend with proper attribution was 1.9x. Brand was scaling a losing campaign.
No conversion event optimization, optimizing for "link clicks" not purchases
Meta was finding people likely to click, not people likely to buy. Cost per acquisition was 73% higher than it should have been because of the wrong optimization signal.
Monthly spend: $15,000 · Monthly revenue attributed (true): $28,500 · True return on ad spend: 1.9x
After ad cost and platform fees, this campaign was generating a small net negative on each customer acquired.
$18
Cost per acquisition
4.8x
True return on ad spend
$12
Cost per thousand impressions
3.1%
Click-through rate
What Redefine built
Separate audiences for every funnel stage
Prospecting (1 to 3% lookalikes), consideration (engagers and visitors), and retargeting (cart abandoners, product detail page visitors) each with separate budgets, bidding, and creative
Creative testing system with weekly new variants
3 creative concepts tested each month. Winners scale, losers pause. Creative fatigue tracked at the ad level. Click-through rate maintained above 2.8% consistently.
Server-side tracking with 1-day click attribution window
Accurate return-on-ad-spend reporting using server-side pixel events. All budget decisions based on true attribution, not Meta's inflated self-reported numbers.
True attribution with server-side tracking
Meta's algorithm optimized for highest-value purchasers, not just any purchaser. Average order value increased 28% within 60 days of switching the optimization event.
Same spend: $15,000 · Monthly revenue attributed (true): $72,000 · True return on ad spend: 4.8x
Same monthly budget. Restructured campaigns. 2.5x the revenue in 60 days.
What we manage for you

Five capabilities your current Meta setup does not have.

0x
Median client return on ad spend after 90 days
We configure server-side tracking and set 1-day click attribution windows. We build a blended model that shows what Meta actually drove, not what it claims. Every week you see the real number, not the flattering one.
Server-side pixel1-day attributionBlended model
Full-funnel audience architecture
Prospecting, consideration, and retargeting audiences, each with its own budget. Your best customers stay out of prospecting, so you stop paying to reach buyers you already have. Cart abandoners get retargeted within 12 hours, not 7 days.
Top of funnel: lookalikes 1 to 3% · Mid: page engagers · Bottom: cart abandoners, product detail page visitors
3
New creative concepts tested monthly
Creative rotation system
Winners scale. Losers pause within 7 days. We track ad-level creative fatigue and never let a single creative dominate for more than 3 weeks without a refresh.
Value-based purchase event optimization
We optimize for highest-value purchasers, not just any click. Meta's algorithm finds the customers most likely to spend the most, not just any visitor who might buy. Average order value increases within 60 days of the switch.
Weekly performance reporting, no jargon
Every Monday your dashboard updates with true return on ad spend, creative performance rankings, audience health, and one recommended budget move for the week. No agency jargon. No vanity metrics. Just decisions.
Return
Acquisition cost
Budget
Proof

7x return on paid advertising. $80K monthly revenue. Same budget.

0x
Return on paid ad investment
Paid campaigns achieved a reported 7x return on investment, compared to industry median of 2.1x for Facebook Marketplace advertising in the category.
$0K
Monthly revenue from paid channels
Monthly revenue reaching $80K from paid advertising campaigns, directly attributable to improved listing performance, targeting, and creative optimization.
Unified operations, higher conversion
Operational workflow integration
Operational workflows for listings, ads, inventory, and payments were streamlined, reducing manual effort and improving the purchasing experience for acquired customers.
Switch 2 Pure commerce team at fulfillment station reviewing paid advertising revenue milestone on a Meta Ads report with warm light
CommerceBigCommerceFacebook Marketplace
Client
Switch 2 Pure
The Challenge
Facebook Marketplace sales lagged. Inconsistent listings, thin analytics, and scattered workflows held them back. The paid campaigns had no conversion tracking, so no one could optimize. The brand spent budget with no idea what it produced.
The Approach
We rebuilt the paid campaigns with real conversion tracking, cleaner listings, and intent-based targeting. We unified listings, ads, inventory, and payments into one flow. Buyers stopped dropping out of a broken post-click experience.
The Result
0x
return on investment from paid advertising campaigns
  • Facebook Marketplace sales and engagement increased significantly, supported by improved listing performance and targeted advertising
  • Monthly revenue reaching $80K from paid campaigns with measurable return on investment that justified continued budget investment
  • Integrated POS and loyalty capabilities enhanced the customer purchasing experience, supporting sustained revenue growth beyond the initial campaign push
Why Redefine

Most Meta agencies optimize for the campaign. We optimize for your margin.

Some agencies report good-looking numbers. Others actually grow your business. The difference comes down to three things. True attribution, real creative testing, and the honesty to tell you when a campaign fails.

Capability
Other agencies
Redefine
True return on ad spend with server-side attribution
Rarely
Always
Separated full-funnel audience architecture
Sometimes
Always
Weekly creative testing with new variants
Rarely
Always
Value-based purchase event optimization
Sometimes
Always
Campaigns paused when return on ad spend is negative
Rarely
Always
Trusts Meta's self-reported return as the truth
Common questions

Meta ads agency FAQ

Straight answers to what every brand asks before signing.

Get My Meta Ads Audit

No commitment. No pitch. Campaigns live within 5 days of sign-off.

We finish campaign restructuring within 5 days. Return improves within the first 2 to 3 weeks as Meta relearns your signals. Creative test results show within 7 to 14 days. Reaching the 4 to 6x range takes 60 to 90 days of steady work. You get a report every week from day one.

Our Meta Ads management is meaningful from approximately $5,000 per month in ad spend. Below that level, the data volume is too thin to run reliable creative tests or audience splits. At $5,000 to $15,000 per month, we run a focused prospecting plus retargeting structure. Above $15,000, we add full creative testing infrastructure, dynamic catalog campaigns, and value-based bidding. There is no maximum spend cap.

Both models work. If you have an internal creative team, we provide weekly creative briefs with specific angles, hooks, and formats to test. If you do not have internal creative, we work with a network of Meta-specific user-generated-content producers and video editors to produce the assets. Creative production is scoped and priced separately from media management. We tell you exactly what to produce and why, rather than running the same 2 ads indefinitely.

We audit your existing campaigns first. In many cases, your current campaigns have enough value to preserve the audience learning while we restructure the architecture. A clean handover takes 2 to 3 days. During the audit we identify which campaigns to keep, which to pause, and which to rebuild. There is no required downtime and no lost audience learning from a poorly managed transition. We have managed transitions from other agencies multiple times without performance gaps.

The management fee covers: campaign architecture and setup, daily bid and budget management, weekly creative testing coordination, weekly performance reporting, monthly attribution reconciliation between Meta and GA4, and one strategy call per month. Ad spend goes directly to Meta, it is not part of our fee. Creative production, if needed, is scoped separately. There are no hidden fees and no percentage-of-spend billing above the flat management rate.

Get your Meta Ads audit

Submit your brief. Campaigns restructured within 5 days.

No commitment. No pitch. A real look at what your Meta ads are actually returning and exactly what to change first.

Managing in-houseHave an agency, not happyStarting Meta Ads freshReady to scale spend
ShopifyBigCommerceWooCommerceOther

Audit in 3 days. Proposal in 5 days. Campaigns restructured within a week of sign-off.

Brief received
We will review your Meta Ads account and respond within 48 hours with our initial assessment and a clear next step.
5-day launch
True return on ad spend
40+ brands
No commitment

Get on a call with us to see how we can help you

Get a Quote