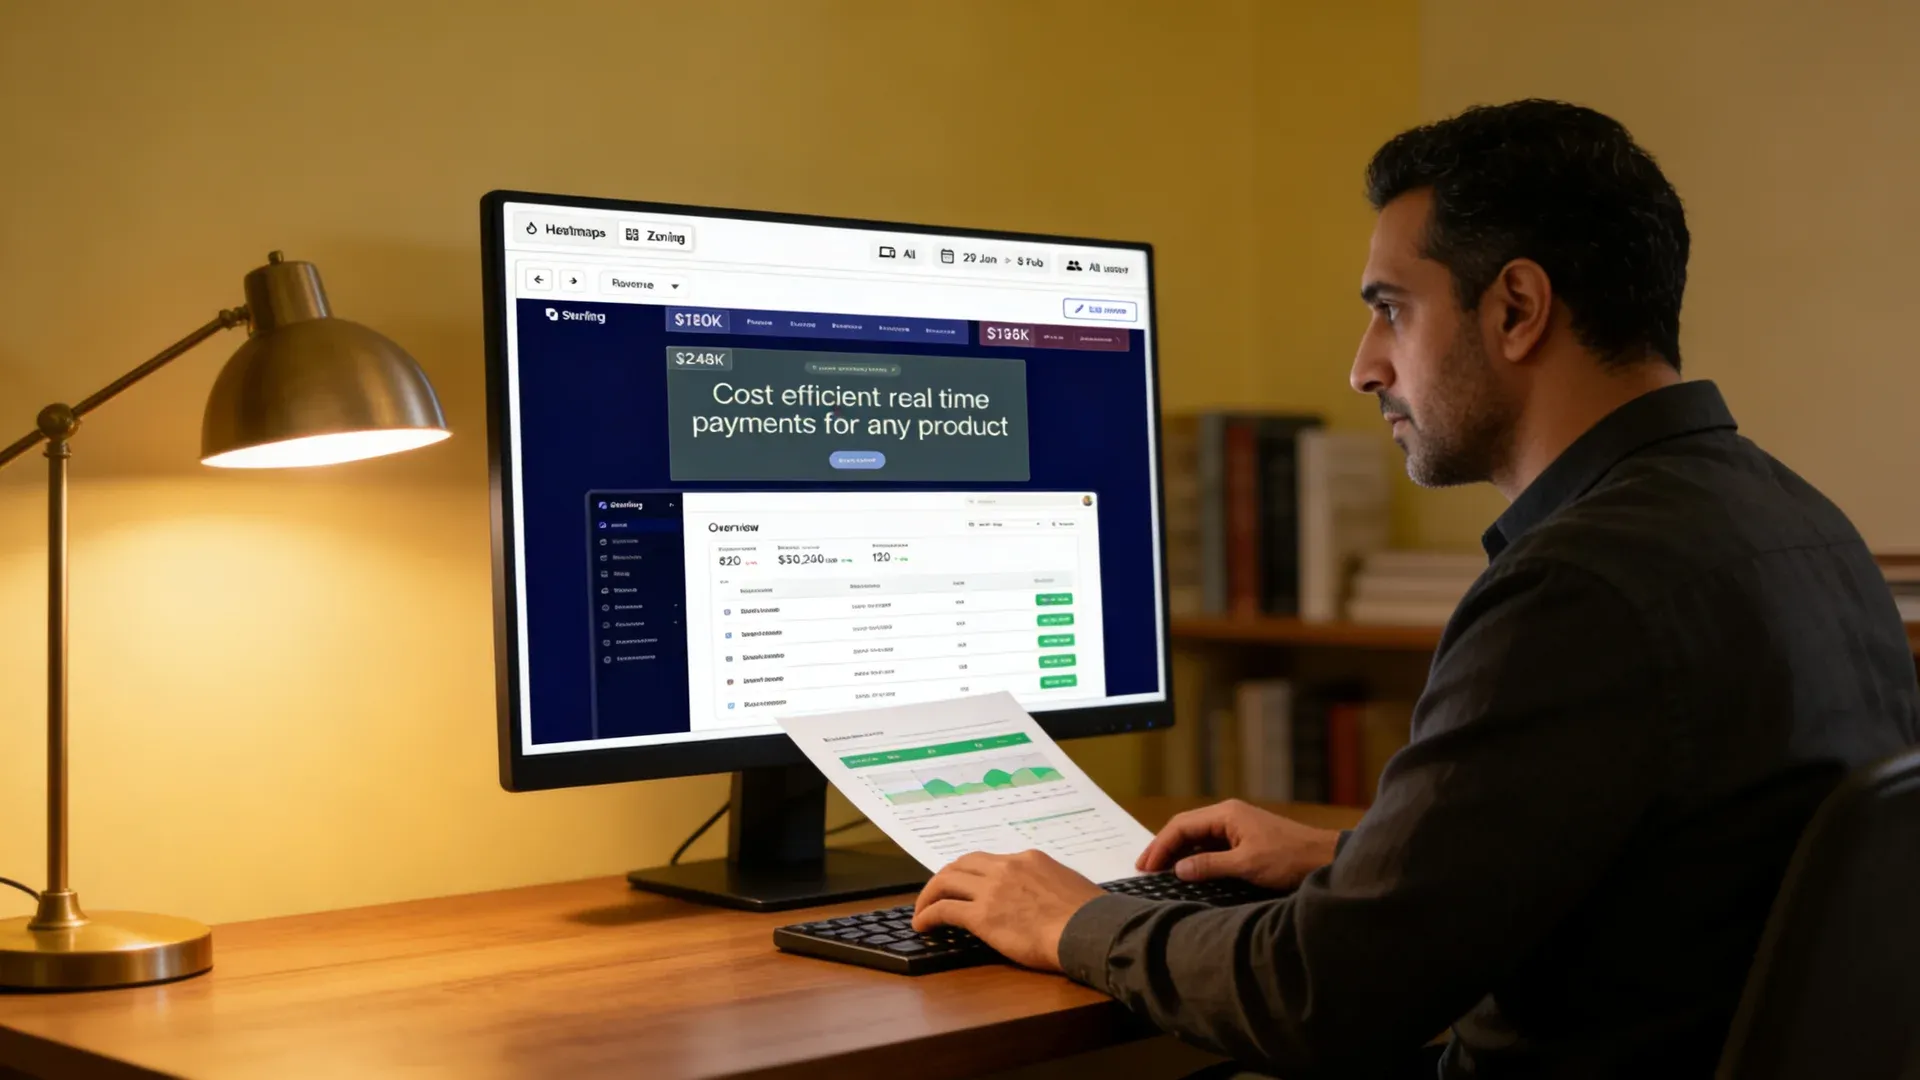
Your site is losing buyers right now. Find out exactly where.
We read your heatmaps, session recordings, and funnel data. We rank every friction point by revenue impact. You get a clear list of what to fix first — in 7 days. Audits often feed Ecommerce design services, Ecommerce development, or a full Website Conversion Audit.
Stop guessing. Start fixing the right problems first.
"We know the site has problems, but we do not know which ones to fix first."
"Bounce rate is high but we cannot explain why. We just keep adding features."
"Checkout abandonment is above 70%. We have made guesses and spent three sprints fixing the wrong things."
"We cannot agree internally on what to prioritize. Everyone has an opinion and no one has data."
"We redesigned the homepage six months ago and conversion did not change."
A ranked list of 10 to 20 friction points, ordered by revenue impact. You know exactly which fix comes first.
Heatmap and session recording data shows where buyers stop and what they try before they leave. Every drop-off explained.
A checkout friction map. Each abandonment step has a named cause and a specific fix attached.
One data-backed priority list your whole team agrees on. No more opinions. No more debates.
A direct answer to why your redesign did not move conversion, and what to change next time.

Every day you wait costs real money. See exactly how much.
Enter your monthly revenue and conversion rate. The calculator shows how much you gain by closing the gap to industry average.
Revenue you're losing each day
Based on closing the gap from your current rate to the 3.0% industry average
Monthly upside if you hit industry average
$0
If a user experience audit and fix brought your conversion rate to industry average
Friction findings
14 issues foundThis is a modeled estimate. An actual audit finds your real friction points using behavioral data, not averages.
Five reports that tell you what to fix, in what order, and what it costs.
Heuristic evaluation
We check your site against 10 usability principles. You see exactly which pages fail and why.
Behavioral analysis
We read your heatmaps, click maps, and session recordings. You see where buyers stop and what they do before they leave.
Funnel drop-off map
We map every step from landing to purchase. You see the exact point where buyers exit and why.
Competitive benchmark
We compare your site to three category leaders. You see where you fall behind and what closing each gap is worth.
Prioritized findings report
Every finding is ranked by revenue impact, paired with a fix, and estimated for dev time. You hand this to your team and start on day one.
Pages evaluated
Principles assessed
23K
Sessions reviewed
67%
Drop-off at checkout step 2
3.8s
Average hesitation before exit
We annotate every behavioral insight with the fix that addresses it.
Each drop-off step is labeled with the friction cause and a fix recommendation.
| User experience dimension | Your site | Leader A | Leader B |
| Mobile usability | Partial | ||
| Checkout steps | 4 steps | 2 steps | 1 page |
| Trust signals visible |
Simplify checkout to 2 steps. Est. impact: +0.6% conversion rate
3 days devMake product images tappable on mobile. Est. impact: +0.3% conversion rate
1 day devAdd social proof above the fold on product detail page. Est. impact: +0.2% conversion rate
2 days devWhat does a UX audit cost?
We scope the price before we start. Every proposal has a line-by-line breakdown. No hourly billing during the work.
See UX Audit PricingOne audit. One month of fixes. Revenue doubled in six months.

Three Islands
Ecommerce · BigCommerceThree Islands sells premium products online. Their buyers expect the site to match the product quality.
The problem
The site was outdated. Mobile didn't work. Checkout had too many steps. Buyers were arriving and leaving without buying. The team didn't know which problem to fix first.
Audit-to-result timeline
Week 1
The audit found 14 friction points
Checkout fragmentation was the biggest revenue leak.
Weeks 2 to 4
We scoped and wireframed the redesign based on audit findings
Responsive layout, simplified navigation, single-page checkout.
Month 2
New site launched
Every design decision tied to a specific audit finding.
6 months later
Revenue doubled year-over-year
Mobile purchase completion increased across every device.
The result
0x
Year-over-year revenue growth
Supported by higher conversion rates and improved customer satisfaction across all devices
- Checkout simplified from multiple steps to one mobile-first flow
- Visual design updated to match the brand's premium product quality
- Every design change traced to an audit finding with a predicted outcome
- Customer satisfaction and conversion both improved
Service
UX audit and BigCommerce redesign
We do three things other audit agencies refuse to do.
We deliver findings in 7 days, not 6 weeks
Most agencies run a "discovery phase" for 3 to 4 weeks before any findings appear. Your conversion loss continues the entire time. We run heuristic review and behavioral analysis in parallel. Day 7 gets findings. Day 8 gets the walkthrough.
- Heuristic review begins on day 1
- Behavioral analysis runs simultaneously, not after
- Findings report delivered at day 7, walkthrough scheduled for day 8
Typical timeline comparison
Typical agency
4 to 8 weeks
Redefine
7 days
Every finding comes with a fix, a dev estimate, and a revenue forecast.
Most audit reports describe what is wrong. They do not tell you how to fix it, what it costs, or how much revenue you recover by fixing it. We include all three for every finding.
- Fix specification: exactly what to change and where
- Development effort estimate: so you can plan your sprint before the report is even 24 hours old
- Priority rank: so stakeholders agree on what to fix first instead of debating it
Sample finding card
Behavioral data: 67% drop-off at step 2. Session recordings confirm confusion with address validation.
Fix: Consolidate to 2 steps. Auto-validate postal code.
We scope and begin implementation the day after the audit
An audit that sits in a document is an audit that changed nothing. If you want us to fix what we found, we move from audit to implementation sprint with no gap, no new contract, and no re-briefing.
- Audit findings become the sprint backlog, not a separate engagement
- Implementation quote is included with the findings report so you can decide the same day
- Take the findings to your own team. Either way, you leave with a plan you can act on immediately.
Audit-to-sprint handoff
Audit findings delivered
Implementation quote included same day
Sprint 1 starts within 1 week of sign-off
Honest answers to the questions every buyer asks us first.
A full UX audit has five parts. First, a heuristic evaluation checks your site against 10 usability principles, page by page. Second, behavioral analysis reviews your heatmaps, session recordings, and click maps. Third, we map your full conversion funnel and label every drop-off point. Fourth, we benchmark your site against three category leaders. Fifth, we deliver a prioritized findings report with a fix, a dev estimate, and a conversion impact forecast for every issue. You receive all five reports in 7 days.
We scope the price before any work starts. The cost depends on how many pages and user flows we review, how much behavioral data you have, and whether you need competitive benchmarking. Submit a brief and we return a line-by-line proposal in 3 days. See the UX audit pricing page for investment ranges.
Three things. One briefing call to explain your business goals and the pages or flows to review. Access to your analytics platform, whether that is Google Analytics, Mixpanel, or another tool. Access to any heatmap or session recording tools you already run. If you don't have heatmaps set up, we set them up before the audit starts. Your total time commitment is 2 to 3 hours across the full engagement.
Both. Take the report to your own development team if you prefer. Or have us fix what we found. We include an implementation quote with the audit delivery so you decide the same day. When you proceed, Sprint 1 starts within 1 week of sign-off. No gap, no re-briefing, no new contract.
A UX audit tells you what is wrong and why, with data behind every finding. A redesign changes the interface. Many teams spend money on redesigns before they know what the actual problem is. That is why redesigns often fail to improve conversion. The audit is the diagnostic step. It tells you which parts of the interface to redesign and in what order. Some findings need a redesign. Others need a single line of code changed. The audit tells you which is which before you spend on either.
Tell us the problem. We tell you what it costs to fix it.
Describe where your site is losing buyers. We scope the audit, price the work, and return a line-by-line proposal in 3 business days.
Call within 48 hours
A senior UX analyst reads your brief and calls to confirm what to review
Scoped proposal in 3 days
Line-by-line breakdown of the audit scope, timeline, and fixed price
Findings in 7 days from sign-off
Audit starts the day you sign. Findings arrive 7 days later.
Your team's total time is 2 to 3 hours. One briefing call. Analytics access. One findings walkthrough. We handle the rest.